Xiaobai Training Camp Lesson 8 - CPU/GPU debug task
How to use Cloud Brain 1 to create debug task
In the dataset course, we have initially mentioned 2 cloud brain environments, cloud brain 1 based on CPU/GPU computing resources, and cloud brain 2 based on Ascend NPU computing resources.
Let’s briefly introduce the cloud brain:
OpenI Community connects with the intelligent computing power cloud brain platform, aiming to provide users with integrated services, which integrates environment construction, online project debugging, running, result analysis and evaluation. At present, Cloud Brain 1 has the function of model debugging, and Cloud Brain 2 has the function of model debugging and model training.
Secondly, the preparations before using the cloud brain are introduced:
You need to be logged in
You need to create a repository first, if there are multiple repositories, select the repository you want to operate
In this lesson, we will introduce the functions of Cloud Brain 1 first.
1. Create a new task
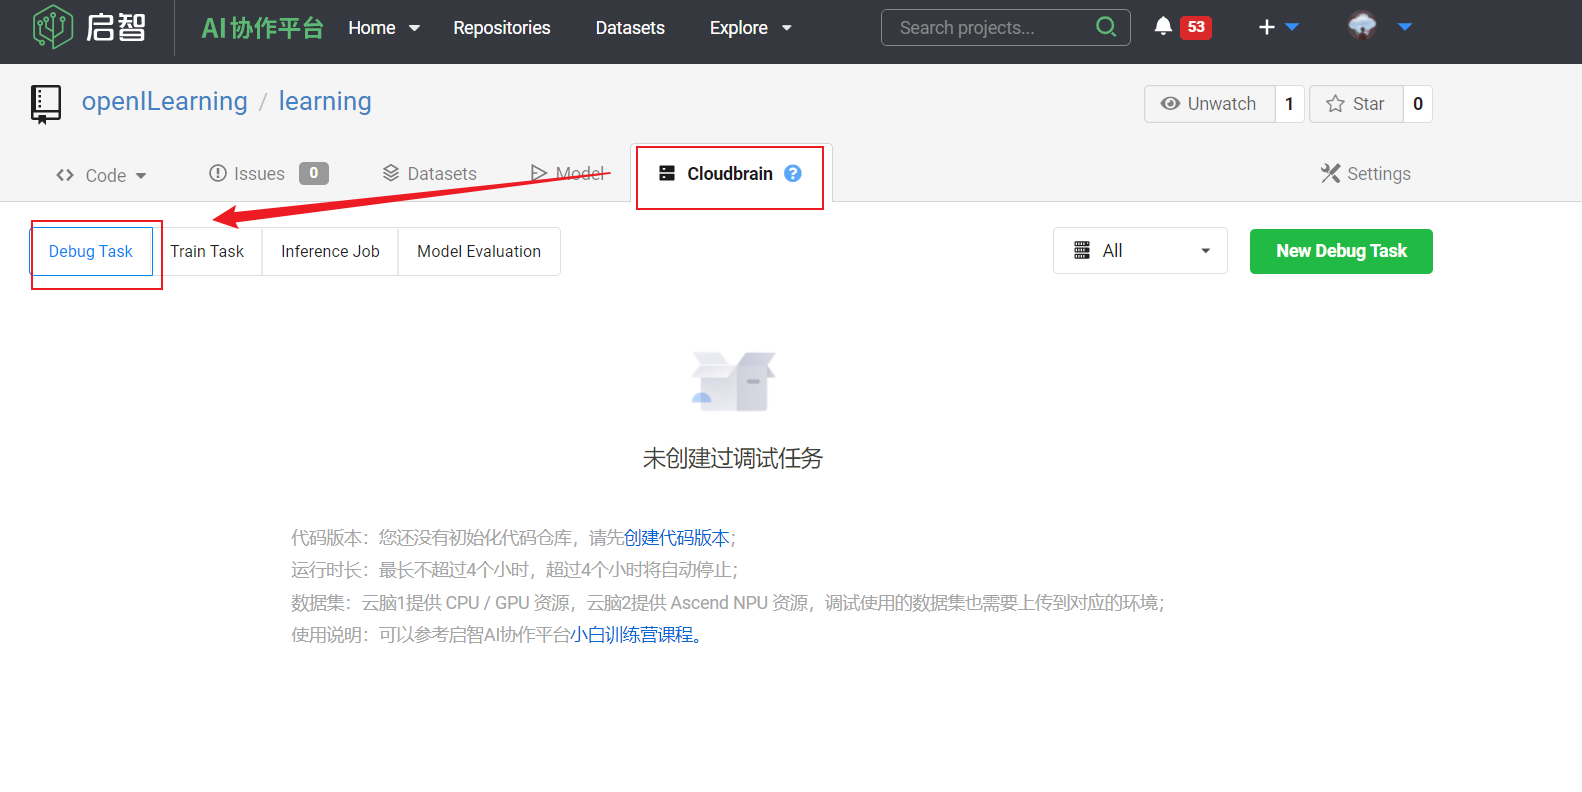
On the repository page, click [Cloudbrain], and the [Debug Task] selected by default. In the [All] drop-down box, you can select CPU/GPU or NPU computing resources to filter tasks.
Click the [New debug Task] button to create a new task:
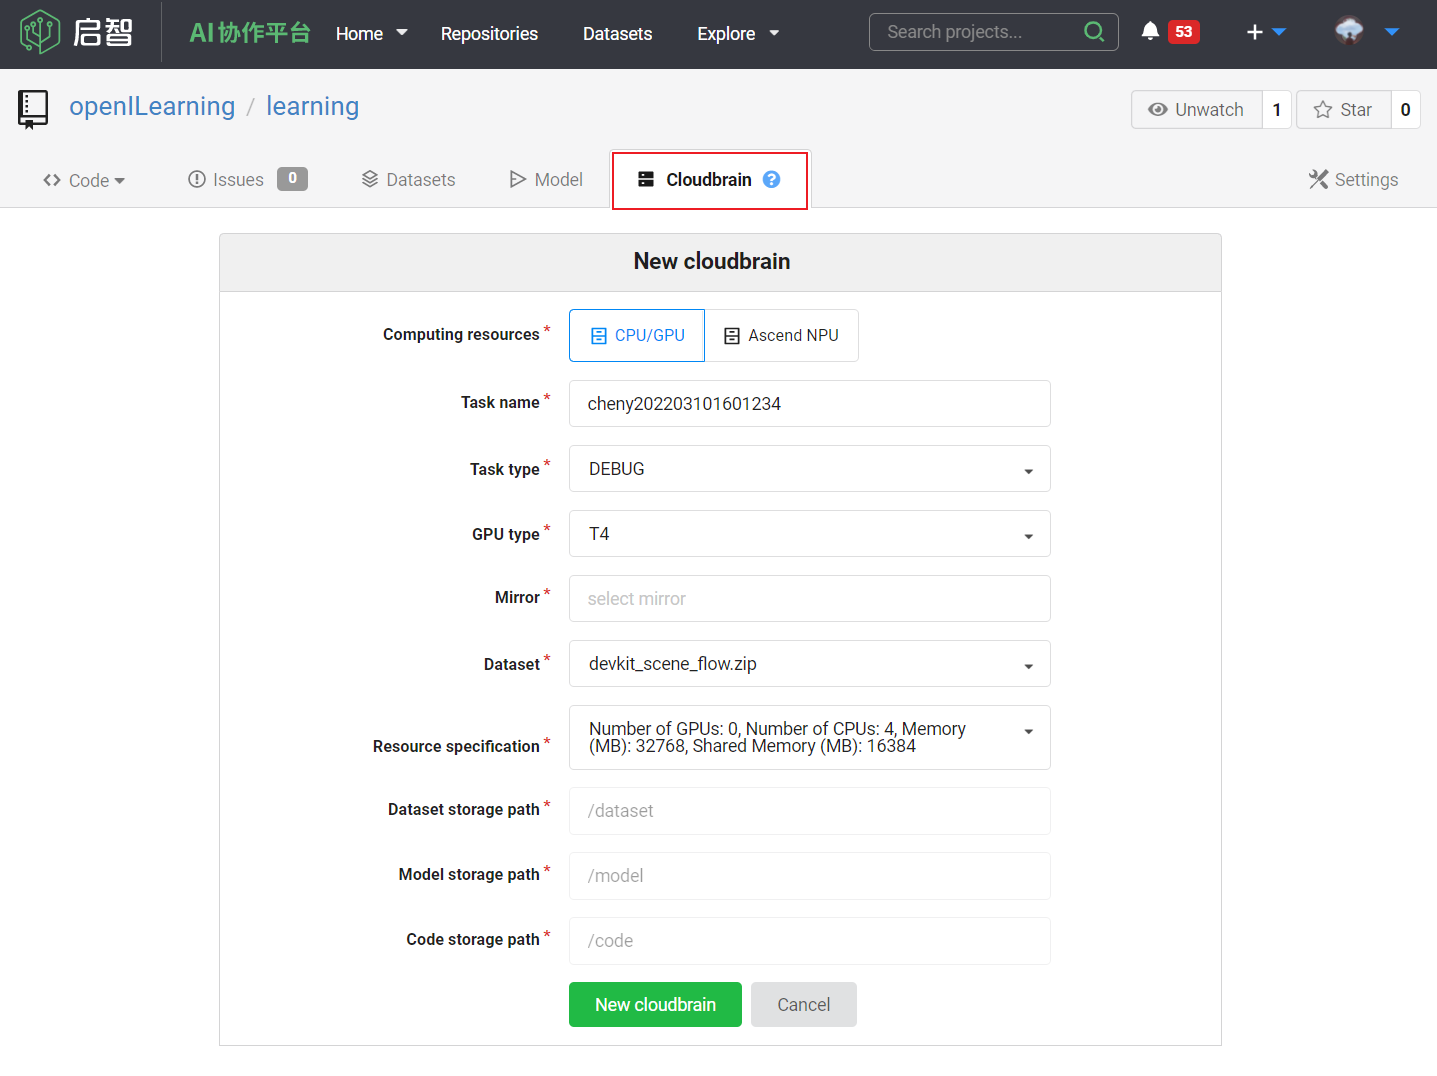
Select the computing resource, you can choose the CPU/GPU resource of Cloud Brain 1, or select the Ascend NPU resource of Cloud Brain 2
GPU type, you can drop down to select the type of T4
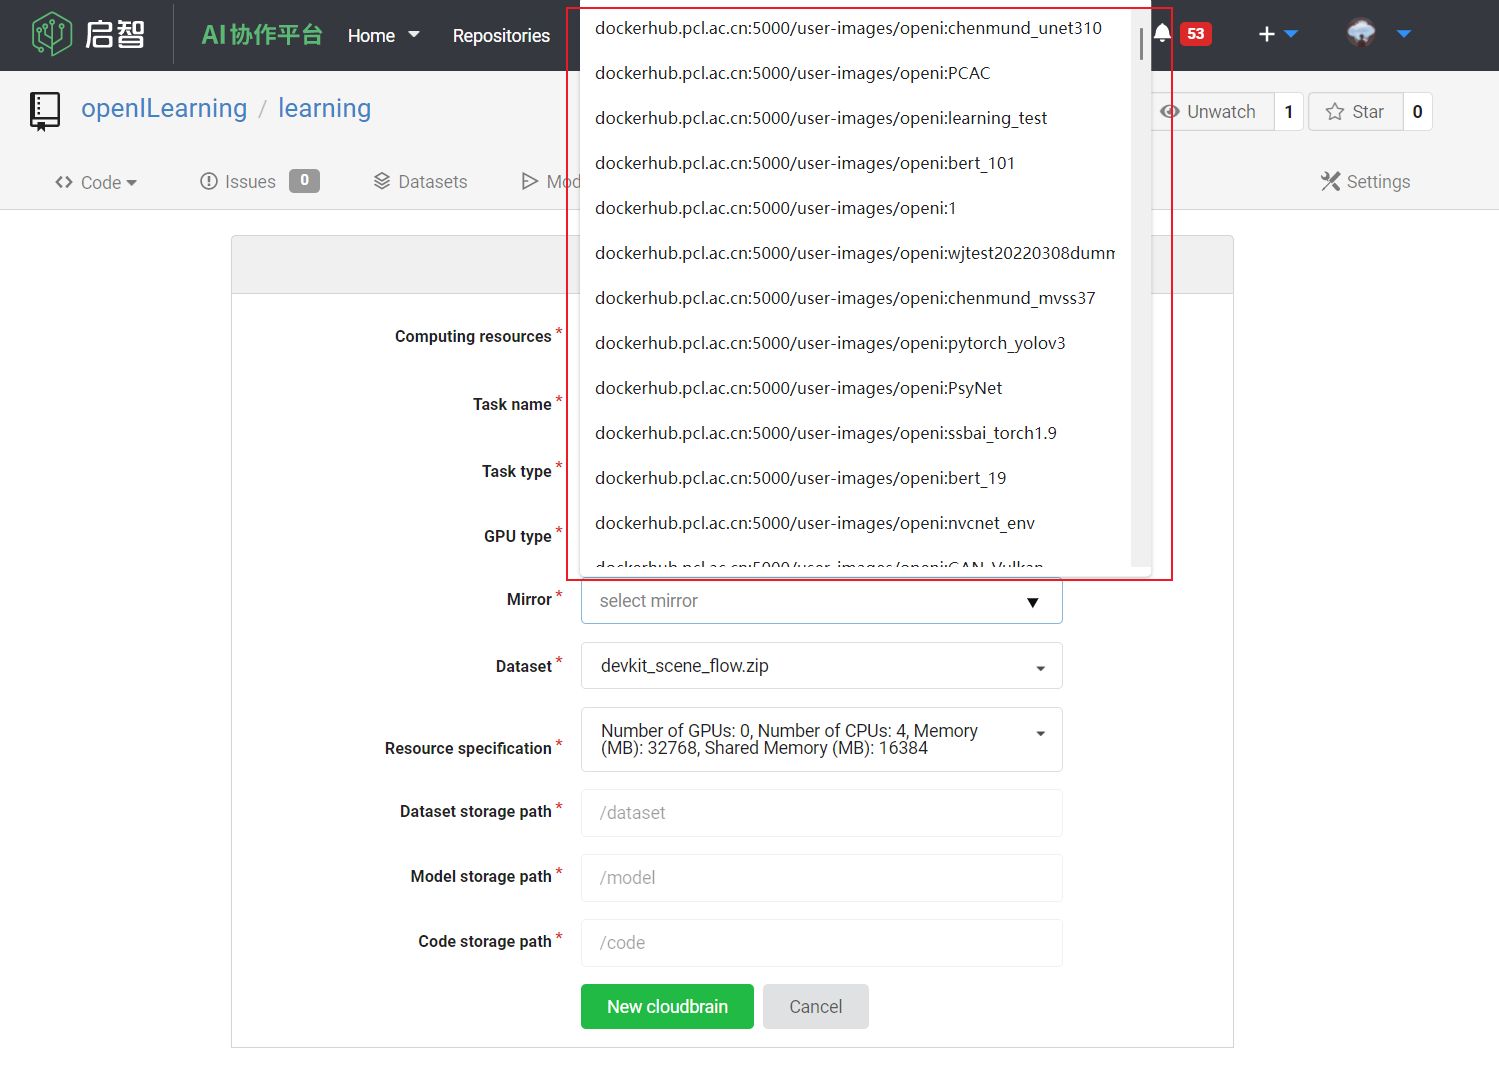
Select the image, you can drop down to select the image that already has the corresponding operating environment, and enter "/" to find the image that you have saved (the image cannot be created here, but after debug, you can save it as your own image environment through [Submit Image], which is convenient Subsequent direct use), after selecting an image, you can click the "X" on the right to quickly delete the current image and select it again
Select a dataset, drop down to select or directly enter the dataset used in your repository (if the dataset used is not in the drop-down list, you need to upload it at the dataset first)
Other options, default
Click [New cloudbrain] to complete the task of creating Cloud Brain 1
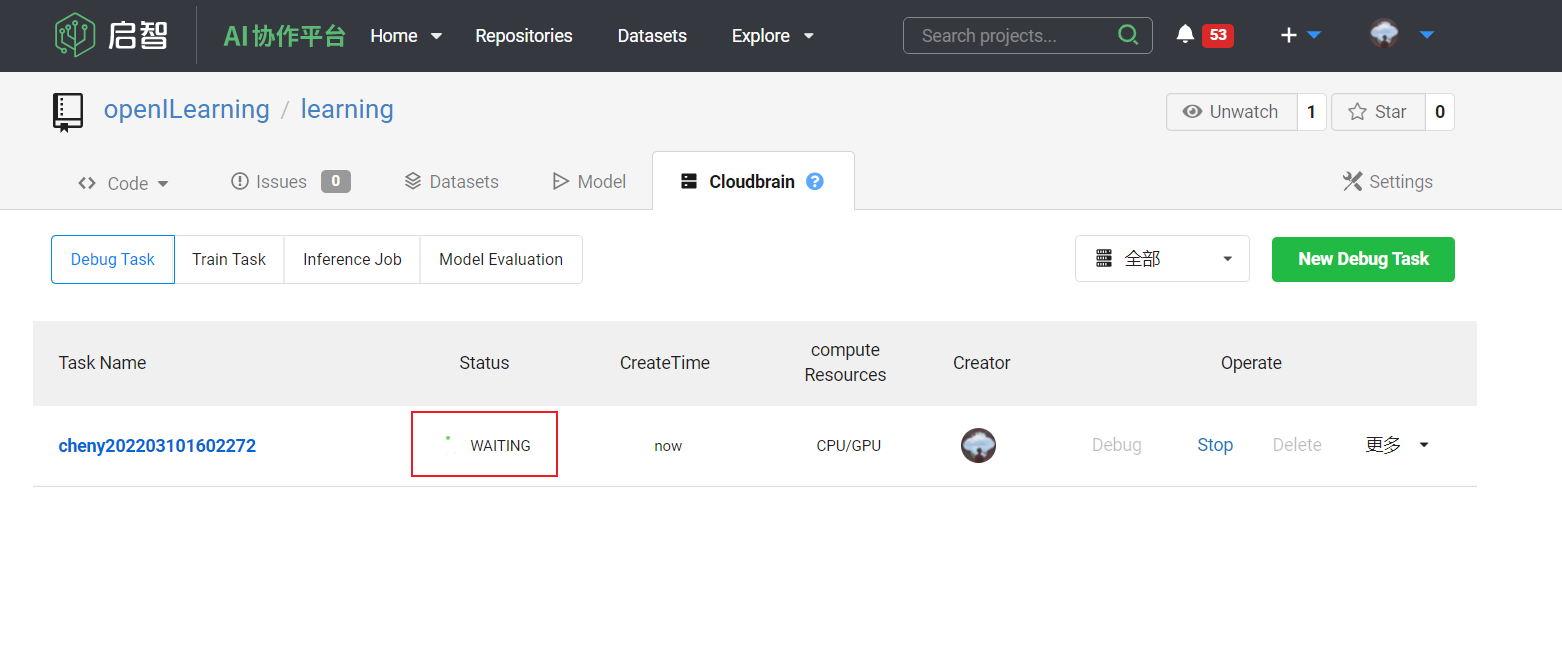
2. Task debugging
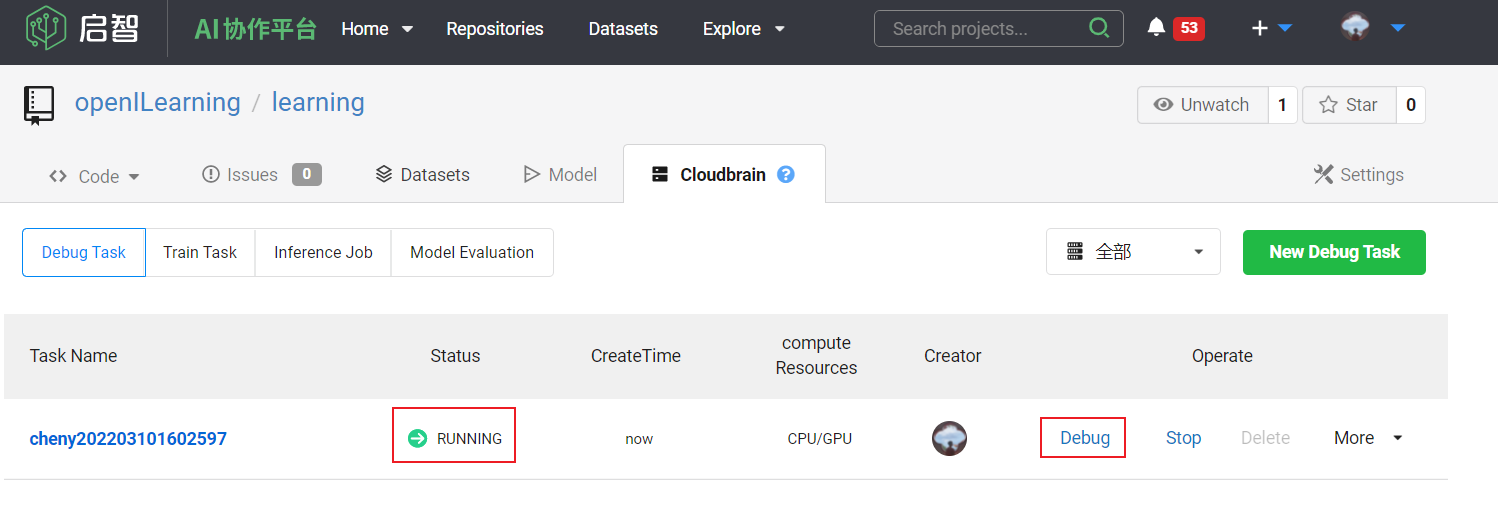
After the task is created, you can start debug until the task status changes to RUNNING state (if the task is displayed in the WAITTING state after the task is created, you can manually refresh it).
In the operation bar on the right, click [Debug] to debug the code;
Click [Stop] to stop the task. Once the task is stopped, it cannot be restarted, and it needs to be operated carefully;
Click [Submit Image], the system will save the image you used when creating the task
Click [Debug] to enter the default debugging interface
Next, we will briefly explain the interface functions.
File Browser page (File Browser)
The default interface is the File Browser page, where you can view the entire repository file. When creating a cloud brain task, the code path is set to /code by default.
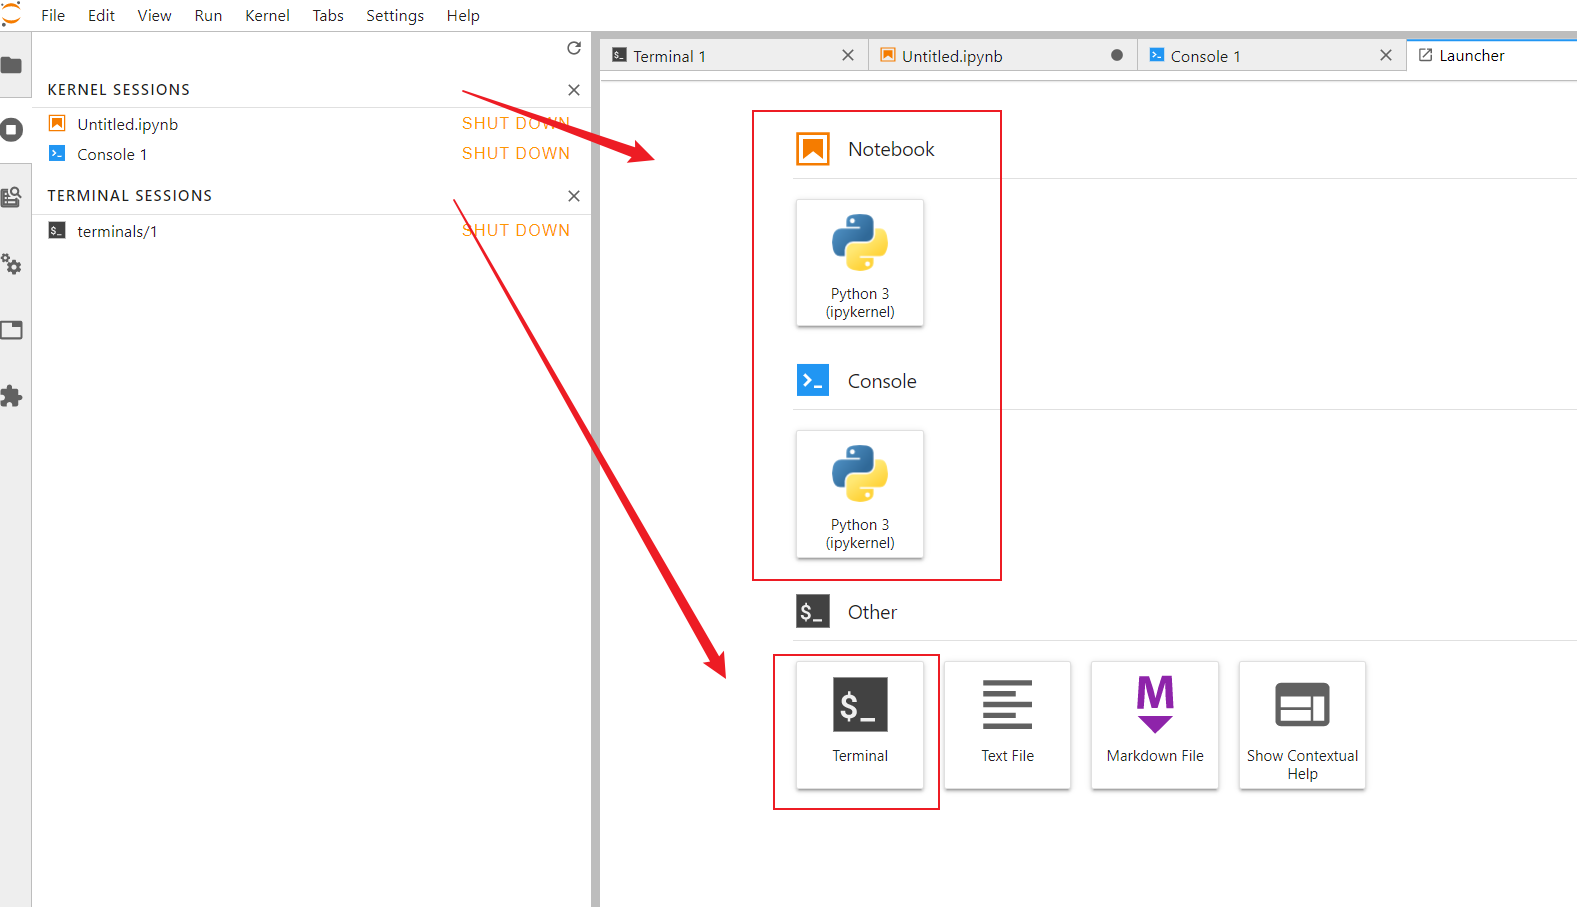
The icons above are shown in the figure. [+] is a new file. After clicking, the [Launcher] window on the right will pop up. You can edit various forms of code files or view help online. You can choose the corresponding form according to your actual needs. code debugging
Among them, there are two forms of python code editing, one is the [NOTEBOOK] method, and the other is the [Console] command line form.
At [Other], you can open the terminal [Terminal], click [Text File] to write a text document, click [Markdown File] to write a document, and finally click to view the function to use the wizard.
Code running status view (Running Terminals and Kernels)
On the Launcher page, click on Python3 of Notebook, Python3 of Console and Terminal of Other to create 3 files, and then click the second icon on the left toolbar to view the running status of these 3 code files
Among them, the KERNEL SESSIONS area displays the Notebook and Console file windows, and the TERMINAL SESSIONS area displays the Terminal file window
Click SHUT DOWN on the right to close the corresponding file
Click the third icon command on the left (Commands), you can select the sub-options in the Annotation 2 area that you want to change in the Annotation 3 Launcher, and change its setting information.
Open Windows (Open Tabs)
Click the 5th icon on the left to view all the opened windows. The other two icons (Property Inspector) and (Extension Manager) are not commonly used, so I won't introduce them too much. You can experience them yourself.
The above is the explanation of the debugging environment. You can debug the code according to the actual situation of the repository.
Finally, let me add to you how to submit mirror images
4. Submit the image
In order to facilitate us to download and use the environment configuration when creating a task, the environment information of this configuration can be saved.
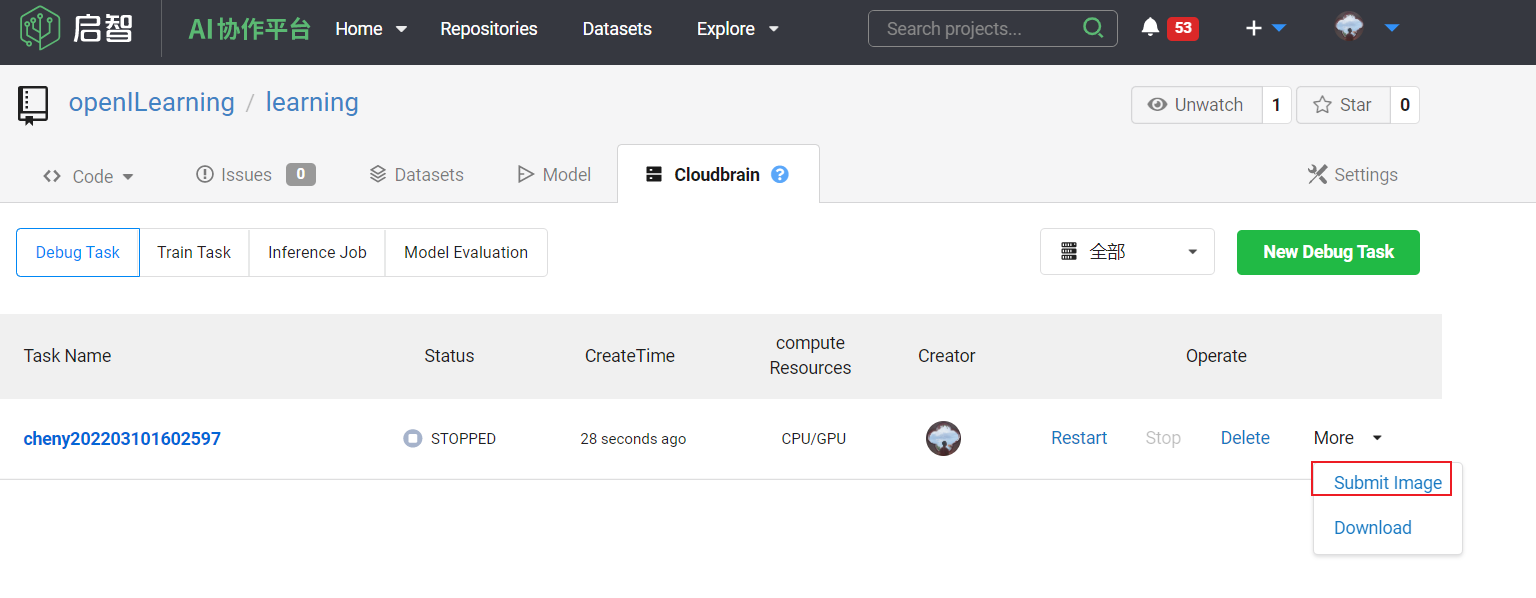
On the [Cloud Brain] page, select the corresponding task whose status is RUNNING, and click [More] in the operation bar to drop down and select [Submit Image]
Add corresponding tags to the image and click submit to save
After submitting the image, click [New Debug Task]. When selecting the image, enter the keyword to select the image we just submitted.
Well, the functions of Cloud Brain 1 are explained here.